Internet of Things – Cognitive Clusters
Technology moves fast, and when predicting the future, it can be hard to keep up. Here at Noggle, we believe in analyzing what’s happening right now in order to gain a more accurate gauge of what’s realistically going to come into being over the next few months and years ahead.
To do this, where better to look for the ideas of the future than in the worldwide Patents database? Examining the concepts that have been submitted and protected now, gives a strong indication of where technology is heading and what innovations are taking place. Of course, not all inventions are created equal, and many patents won’t last the course and make it into our collective future conscious and culture – this is why we have produced a broad overview of recent patents, and picked up on recurring and common aspects and topics. By detecting clusters and averages of prevalent and frequently appearing themes, our findings represent a more likely look at the ideas that may be entering and shaping our lives in the not too distant future.
What’s next for IoT?
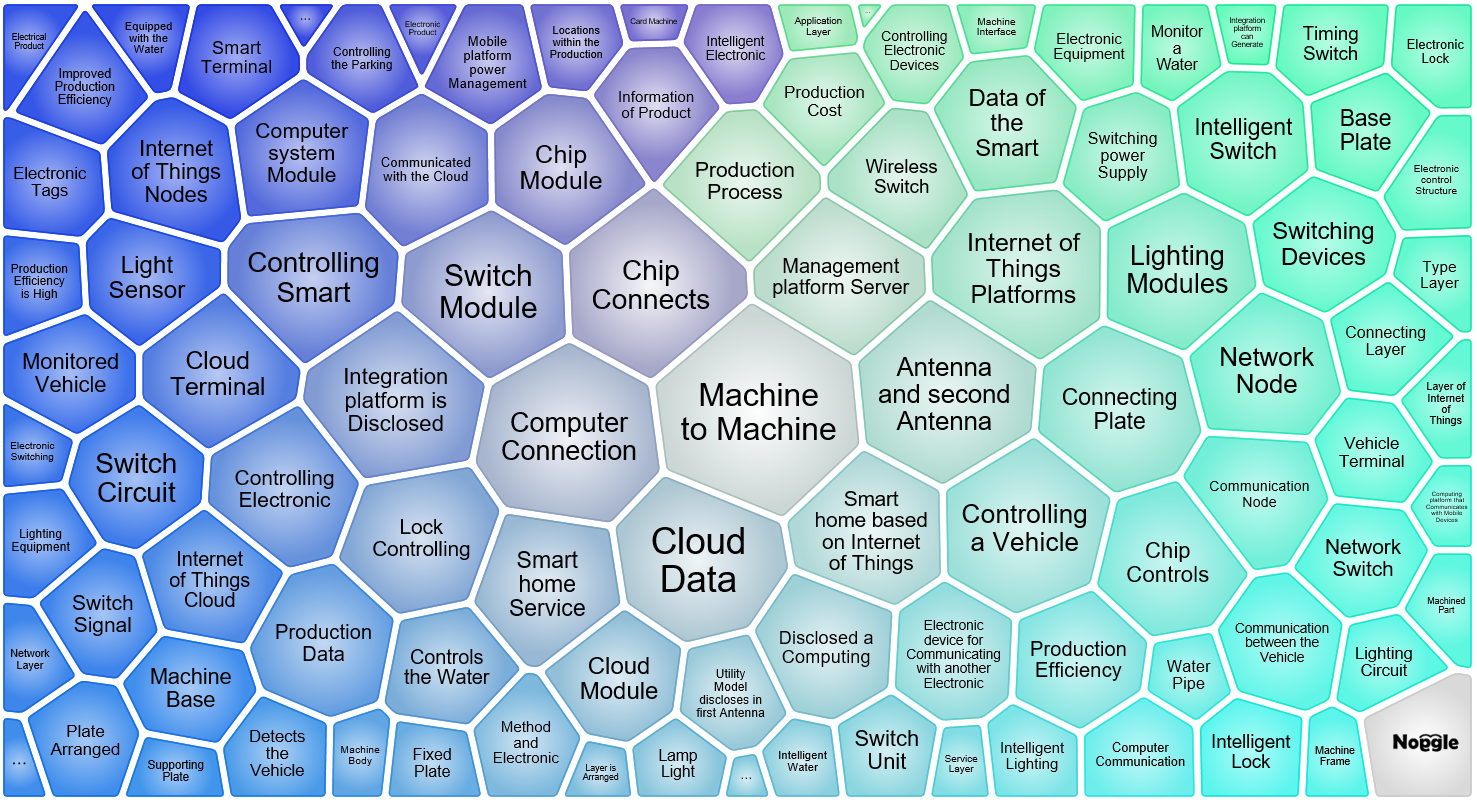
We used this approach to analyse upcoming trends in the field of the Internet of Things (IoT) for this year, and beyond. Below, you’ll see a cognitive map which depicts popular phrases, ideas and subjects for IoT in the current patents database.

IoT Trends Map Internet of Things – Bibliometrics
As you can see, proposals centre around “machine to machine” usage – which is the largest cluster in the centre of the map. So IoT is not for humans – IoT will be used by machines and will bring a new generation of robots to life. These robots may be communicating with lots of machines to make decisions that humans are not able to. That’s the core of IoT – IoT is the ‘brain’ for the age of machines. Compare that to our nervous system where synapses pass chemical signals between neurons. IoT are the synapses of machines. This isn’t science fiction anymore; the patent clusters prove it today.
Move forward in the cognitive map and not far away is the cluster “controlling a vehicle”. So the most expected use of IoT which, as anticipated is vehicles (e.g. cars, ships, airplanes) that will be controlled by machines communicating with each other. Think about a “traffic robot” so instead of a police officer managing the flow for cars on the road because the cars are communicating with each other, you could feed a central machine which decides about speed and stops. Expect this kind of smart traffic management to show up in all areas during the next 1-3 years.
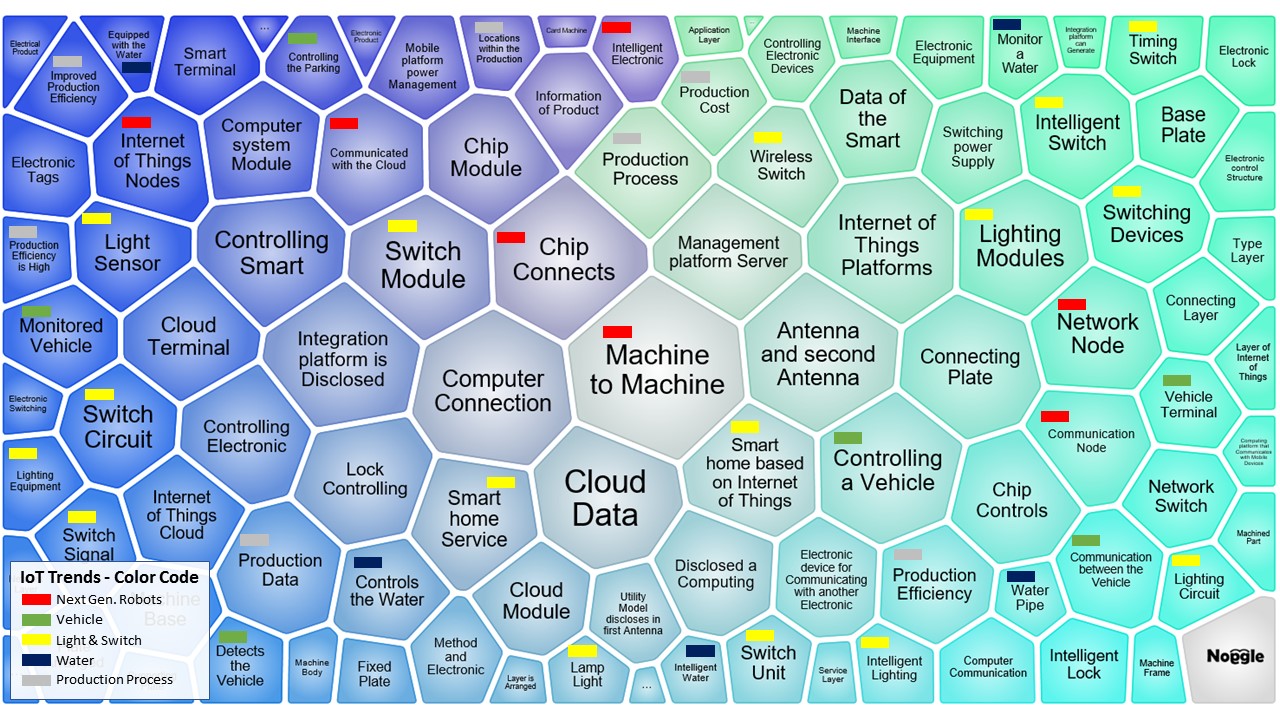
We can then group these items together further. In the following visual, you’ll see how these clusters relate to each other with color highlighting.

IoT Trend Clusters Grouped
By connecting these subjects, we can clearly see that immediate technological growth is also focused on powering and monitoring our living spaces utilizing intelligent switches, sensors for lights and water flows.
Discover trends at a glance
This graphic visualisation of submission patterns allows us to identify the following key trends for IoT:
1. Machine-To-Machine – Next generation robots:Named clusters for ‘M2M’ with communicating ‘nodes’ including intelligent and connecting ‘chips’. Watch out for new robot-alike assistants. E.g. Alexa and Siri communicating with lots of devices in the years to come.
2. Vehicles – Say “Hello” to Smart Traffic:
Named clusters include ‘monitored vehicle’, ‘vehicle terminal’, ‘controlling a vehicle’ and ‘detects a vehicle’. So you wont drive alone anymore.
Named clusters include ‘monitored vehicle’, ‘vehicle terminal’, ‘controlling a vehicle’ and ‘detects a vehicle’. So you wont drive alone anymore.
3. Lighting & Switch management – The Smart Home becoming the new normal:
Intelligent devices used to control lighting, with clusters such as ‘light sensor’, ‘lighting modules’, ‘lighting circuit’, ‘intelligent lighting’, ‘lamp light’ and phrases such as ‘smart home’, ‘smart home services’ and ‘intelligent switches.’
Intelligent devices used to control lighting, with clusters such as ‘light sensor’, ‘lighting modules’, ‘lighting circuit’, ‘intelligent lighting’, ‘lamp light’ and phrases such as ‘smart home’, ‘smart home services’ and ‘intelligent switches.’
4. Water management:
Clusters show interest in areas of ‘intelligent water’, ‘water pipe’, ‘controls water’ and ‘equipped with the water.’
Clusters show interest in areas of ‘intelligent water’, ‘water pipe’, ‘controls water’ and ‘equipped with the water.’
5. Data explosion in production processes:
Automation looks set to gain momentum in 2017, with clusters outlining ‘production data’, ‘production process’ and ‘production costs.’
Automation looks set to gain momentum in 2017, with clusters outlining ‘production data’, ‘production process’ and ‘production costs.’
Finally, we can expect to see massive growth in machine-to-machine data communication with new cloud based management and integration platforms for IoT coming into real world application in 2017, with an associated influx of new management software coming to market for the management of IoT devices in production processes.
Creating cognitive clusters
Already, our smart search and cognitive clustering has provided us with a valuable insight into the ideas that are being developed and registered in the world of IoT, some of which will eventually come to fruition and affect our daily lives. But how did we do it?
Any Noggle user can create similar intelligently curated trend diagrams – on this occasion, we simply issued a search request to the worldwide patent database on our chosen subject of Internet of Things. (A search could also be run on one of Noggle’s other third party databases, such as our comprehensive listing of Ted Talks, and open access science articles and research journals.)
We used a very generic and broad request in this example. You could even start with more specific terms to get more specific clusters. This produced over 6,000 patent results, allowing us to then run the ‘clustering’ algorithm – our artificial intelligence text processing automatically scans all of these search responses for similarities, in a manner which is not biased towards any specific clustering output. Within 20 seconds, we could see common ideas organised together in a way that is both manageable and interesting to evaluate. From a conceptual view, it is a way of bringing the approach of Scientometrics to real life on every desktop. Scientometrics is no longer a theoretic topic for experts with huge machine power – everyone can start doing trend research today.
But the map is more than just an image – we can delve deeper into each cluster to examine the individual patents that have been grouped together. To explore the collection for yourself, Noggle clients can browse the IoT cognitive cluster map discussed within this article at: https://www.noggle.online/knowledgemap/internet-of-things-trends-to-watch-2017/


No comments:
Post a Comment